LIVE 3-DAY PRICE VIBRATION TRADING MASTERCLASS

DECODE PRICE. MEASURE MOVEMENT. ANTICIPATE WHAT'S NEXT.

Discover a different way to study the market through Institutional Behaviour, Supply & Demand, Price Clusters and Mathematics, to understand price direction, market intention and movement.

Raajshekar, Gann Analyst
NO INDICATORS NO TIPS NO GUESSWORK
LIVE ON ZOOM · 3 DAYS · 90 MINUTES/DAY

99ALL 3 LIVE DAYS
00HOURS
00MINUTES
00SECONDS

WHY DOES PRICE STOP AT A SPECIFIC VALUE?

PRICE IN NEW TERRITORYALL-TIME HIGH
NEXT REFERENCE POINT ? PRIOR HIGH
A stock reaches a new All-Time High.
There may be no obvious historical resistance above it.
Yet price can still pause, react, continue or reverse. Why?
Where does the next reference point come from?
What creates the imbalance between buyers and sellers?
Can institutional participation leave footprints in price?
And when price enters new territory, can mathematics help measure its movement within a specific time range?

These questions lead to a different way of studying markets.

PRICE VIBRATION METHOD Decode Price. Measure Movement. Anticipate What's Next.

PRICE IS NOT JUST A CHART.
IT IS INFORMATION.

Inside the masterclass, you'll explore:

01

INSTITUTIONAL BEHAVIOUR

Understand how larger market participation can influence price behaviour and leave observable footprints.

02

SUPPLY & DEMAND

Understand the forces and imbalances behind significant price reactions.

03

PRICE CLUSTERS

Study significant areas of price activity and learn how they can help reveal direction and market intention.

04

DYNAMIC PRICE DATA

Learn to observe what the market is communicating as price evolves.

05

MATHEMATICS

Explore how mathematical relationships can help measure price movement within a specific time range, including when price moves into new territory.

DECODE PRICE. MEASURE MOVEMENT.
THIS IS THE PRICE VIBRATION METHOD

PRICE · DECODE

Institutional Behaviour
Supply & Demand
Price Clusters
Dynamic Price Data
Direction · Intention · Behaviour

MATHEMATICS · MEASURE

Price Movement
Time Range
Price Levels
Mathematical Relationships
Measured Price Movement
PRICE VIBRATION METHOD

A structured framework for studying price behaviour and measuring price movement.

YOUR 3-DAY JOURNEY

Day 1
DAY 1

WHY DOES PRICE MOVE?

Explore Supply & Demand, institutional behaviour, imbalance and Price Clusters to understand the forces behind significant market movement.

Learn to see what is driving price, not just where it has moved.
Day 2
DAY 2

READ PRICE. UNDERSTAND DIRECTION & INTENTION.

Study Price Clusters and market behaviour to uncover meaningful clues about direction, reaction and market intention.

Learn to read the market instead of reacting to every movement.
Day 3
DAY 3

DISCOVER THE PRICE VIBRATION METHOD

Bring Price and Mathematics together. Explore how mathematical relationships can help measure price movement within a specific time range and provide a structured framework for anticipating what may come next.

Experience the methodology live on real market charts.
FREE
Introduction to the Square of 9
BONUS

INTRODUCTION TO THE SQUARE OF 9

A special introduction to the mathematical side of Gann market analysis.

INCLUDED FREE WITH YOUR 99 MASTERCLASS

NO INDICATORS.
STUDY PRICE ITSELF.

You don't need another chart crowded with signals.

LEARN TO FOCUS ON:

Price Price Clusters Supply & Demand Institutional Behaviour Direction Intention Mathematics

See the market differently.

CROWDED WITH SIGNALSPRICE ITSELF

WHO IS THIS FOR?

SERIOUS TRADERSFor those who want to study price beyond conventional indicators and signals.
BEGINNERSFor those who want to build their market understanding from price itself.
WORKING PROFESSIONALSFor those looking for a structured approach to studying markets.
GANN STUDENTSFor those interested in the mathematical dimension of market analysis.

WHO IS THIS NOT FOR?

If you're looking for:

Guaranteed returns Stock tips Buy/Sell calls Signal services Instant profits
This masterclass isn't for you.This is about learning how to study price.
MEET YOUR HOST
Raajshekar

RAAJSHEKAR

GANN ANALYST · 15 YEARS IN THE MARKETS
Founder, GannMathTrading Academy
0Years in
the Markets
0Live
Sessions
0Minutes
Each Day

Raajshekar brings together Gann, Institutional Behaviour, Supply & Demand and Mathematics to develop structured approaches to studying price.

THE FOCUS UNDERSTAND PRICE. No Tips. No Calls. No Guesswork.

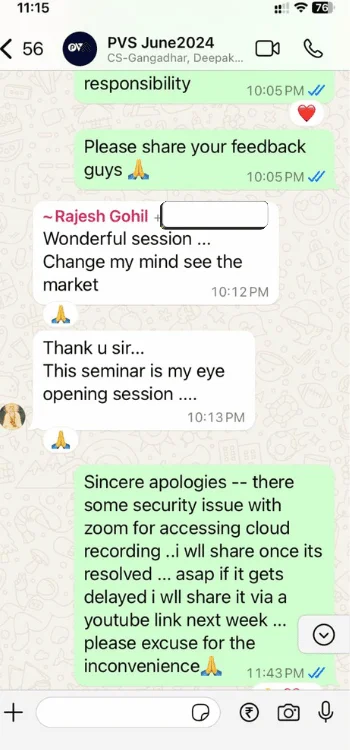
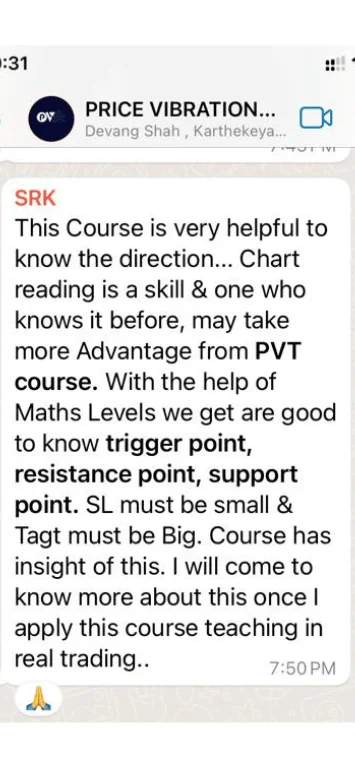
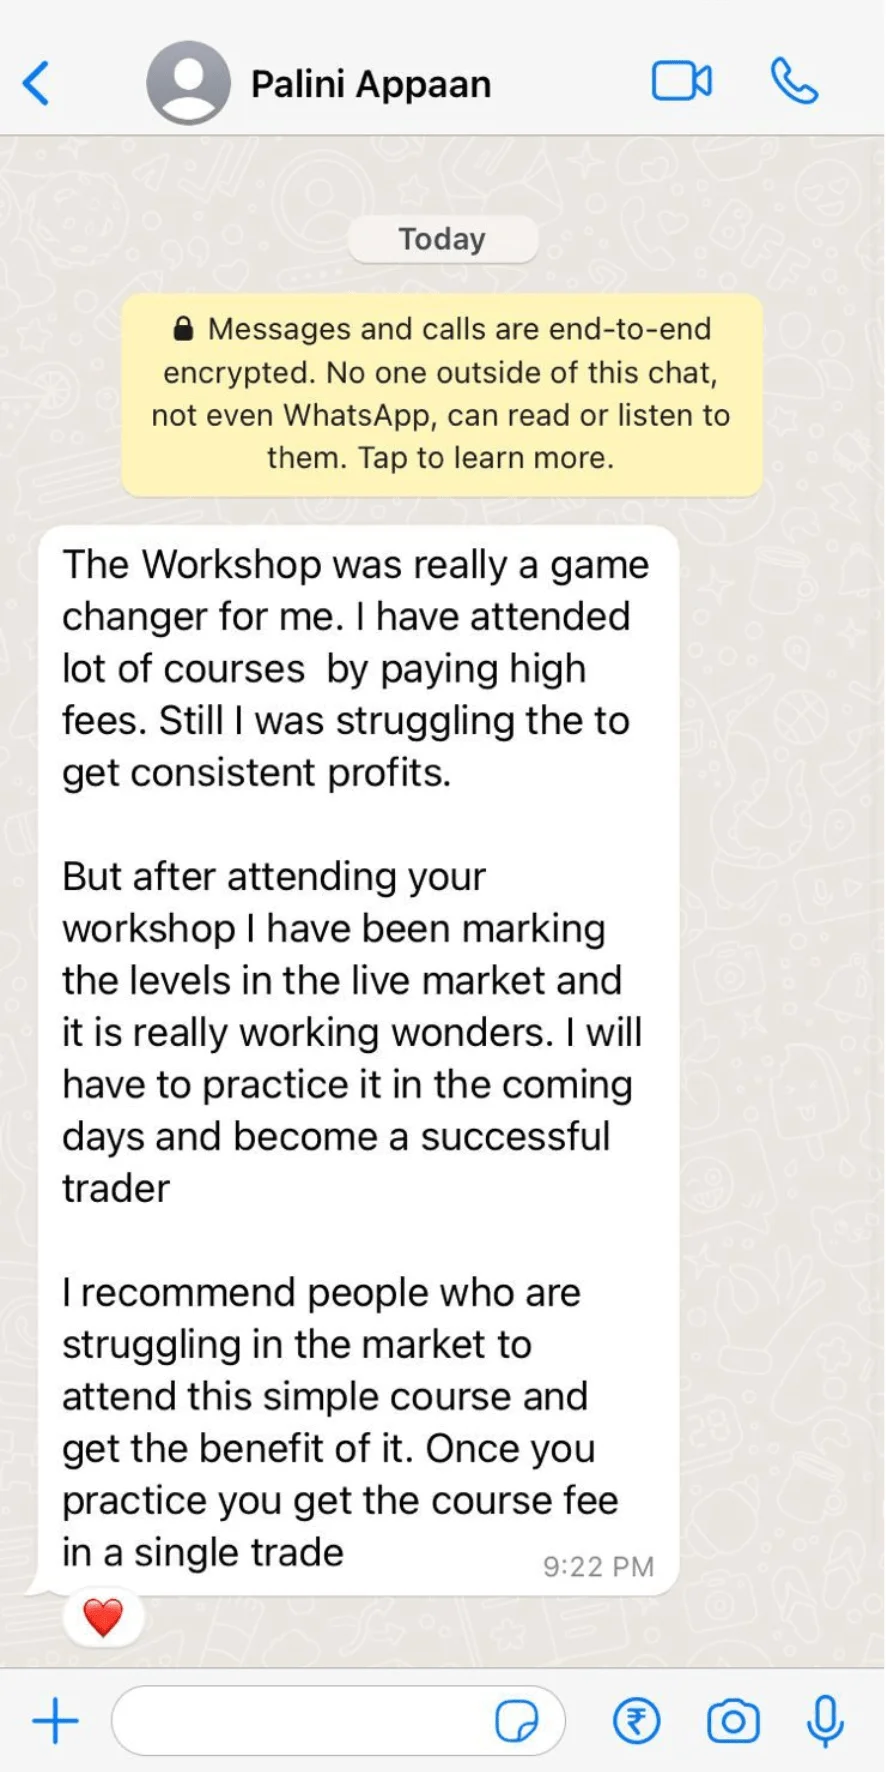
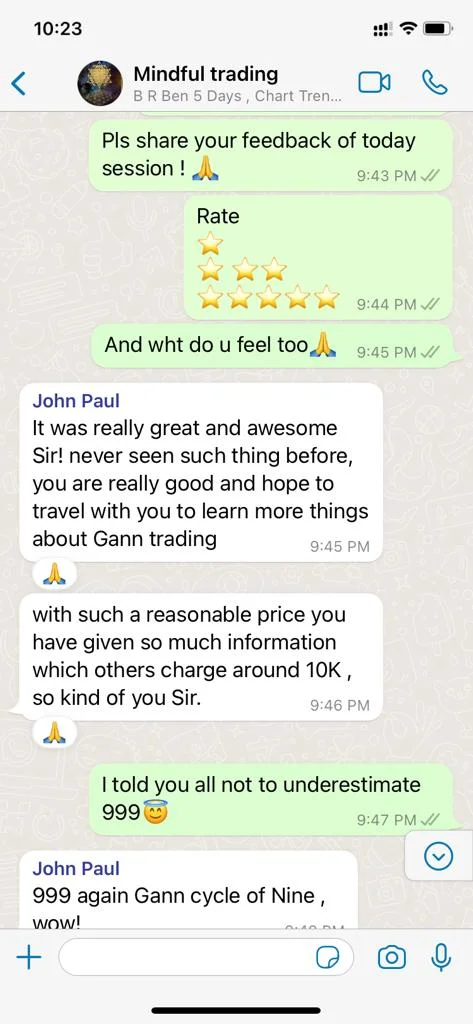
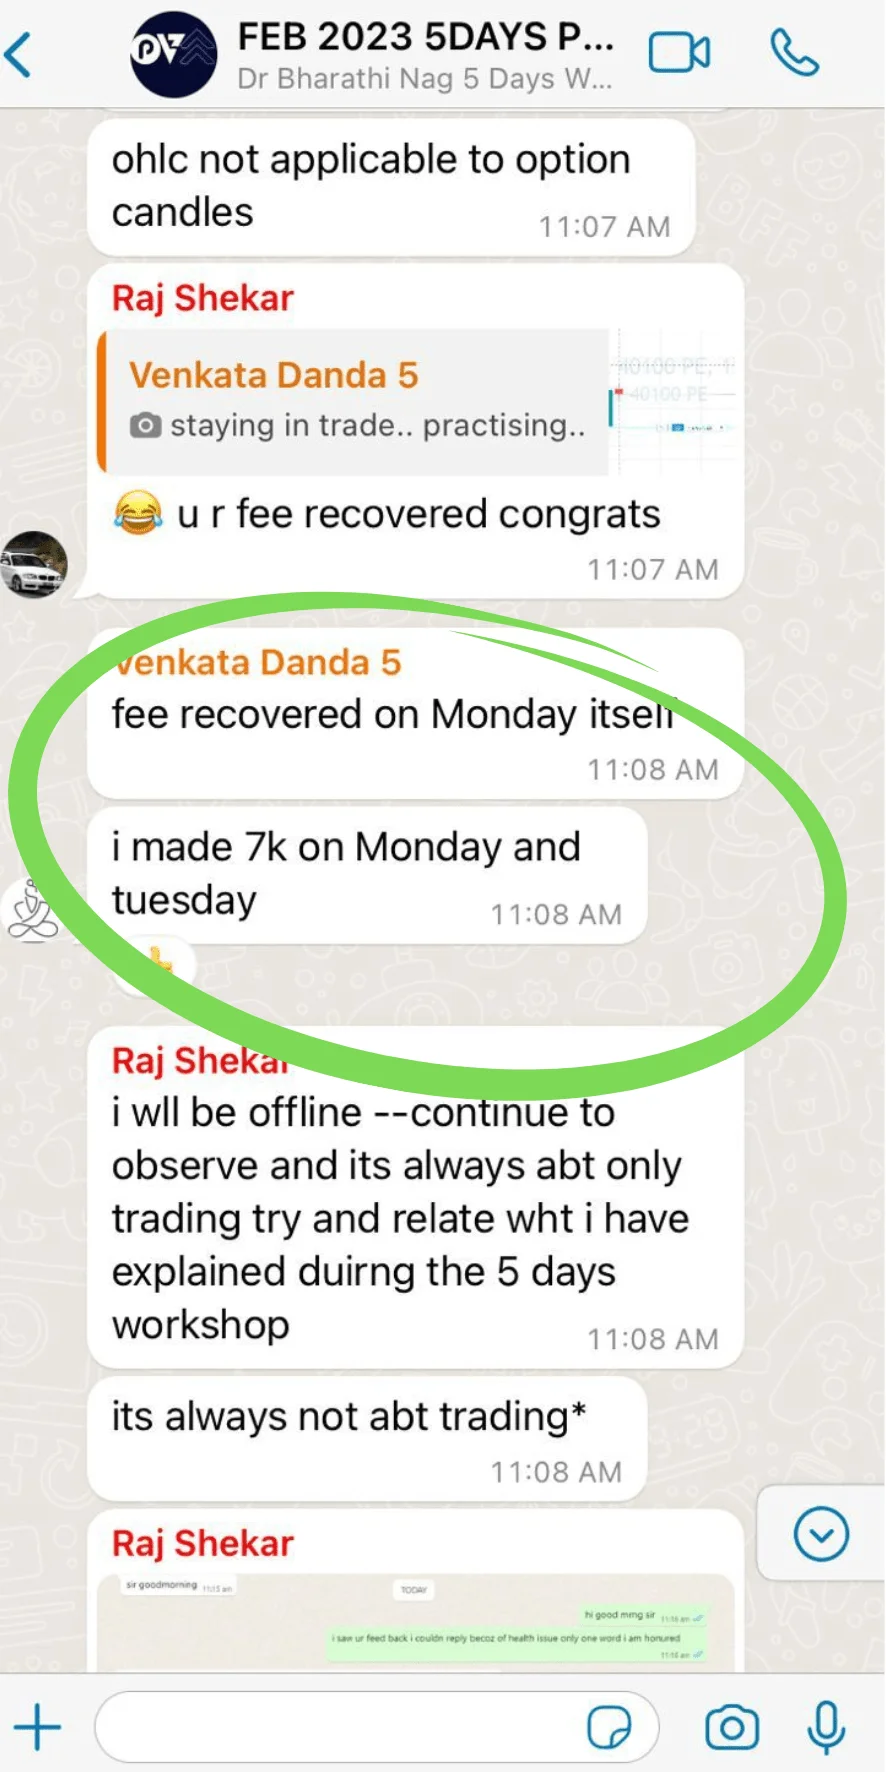
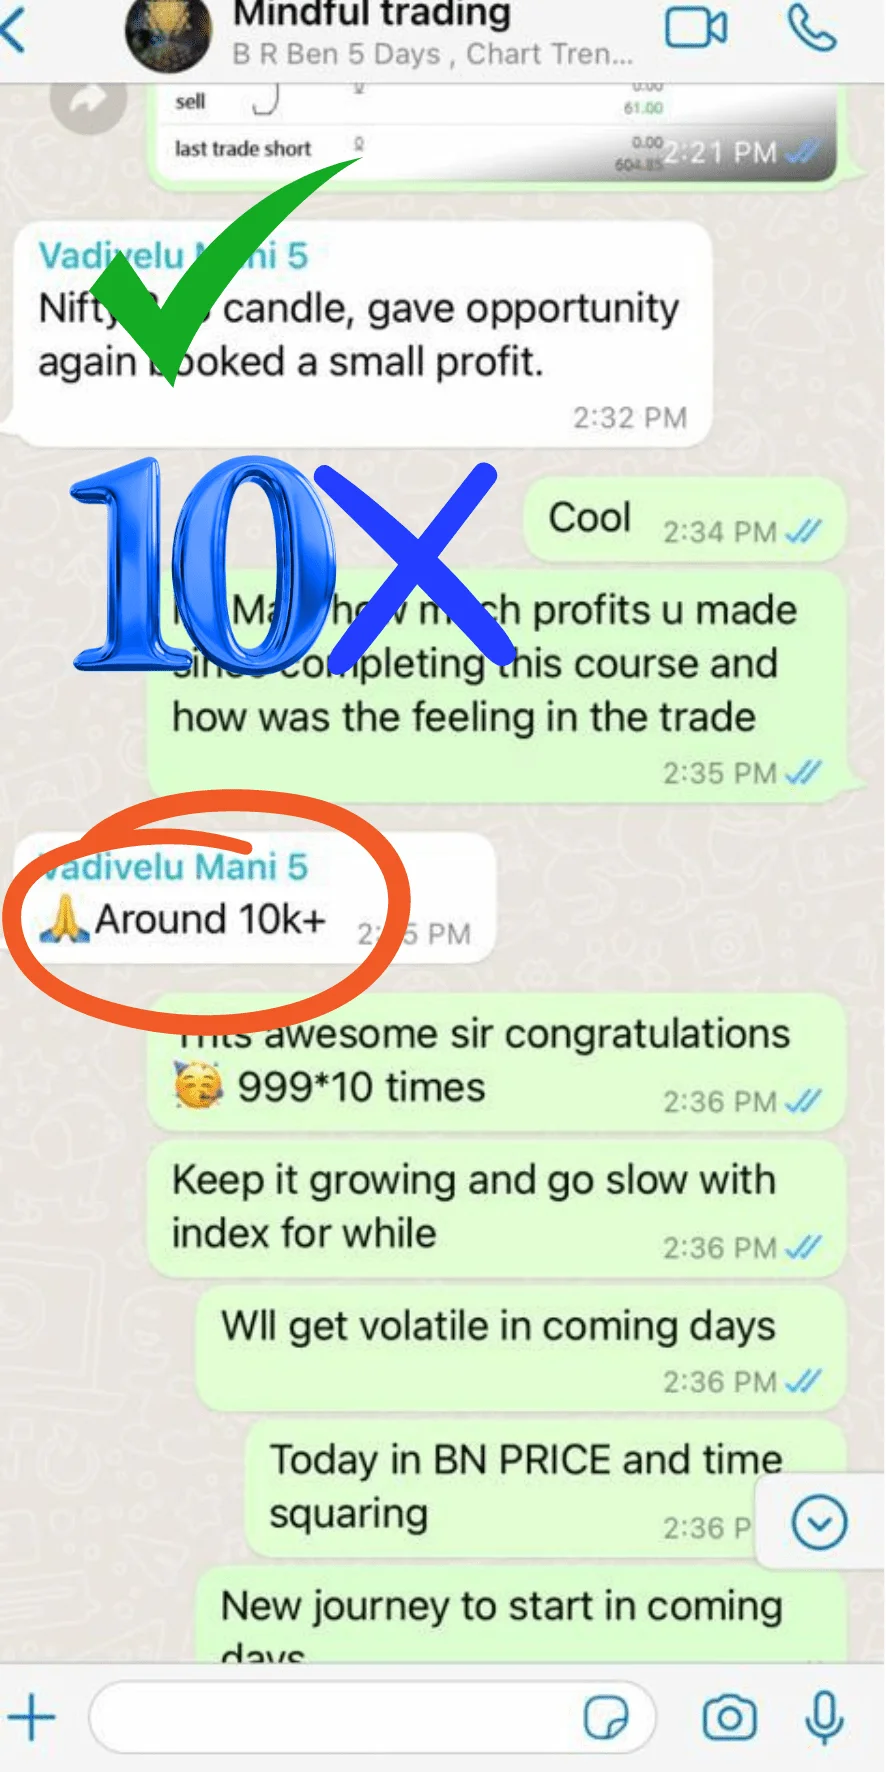
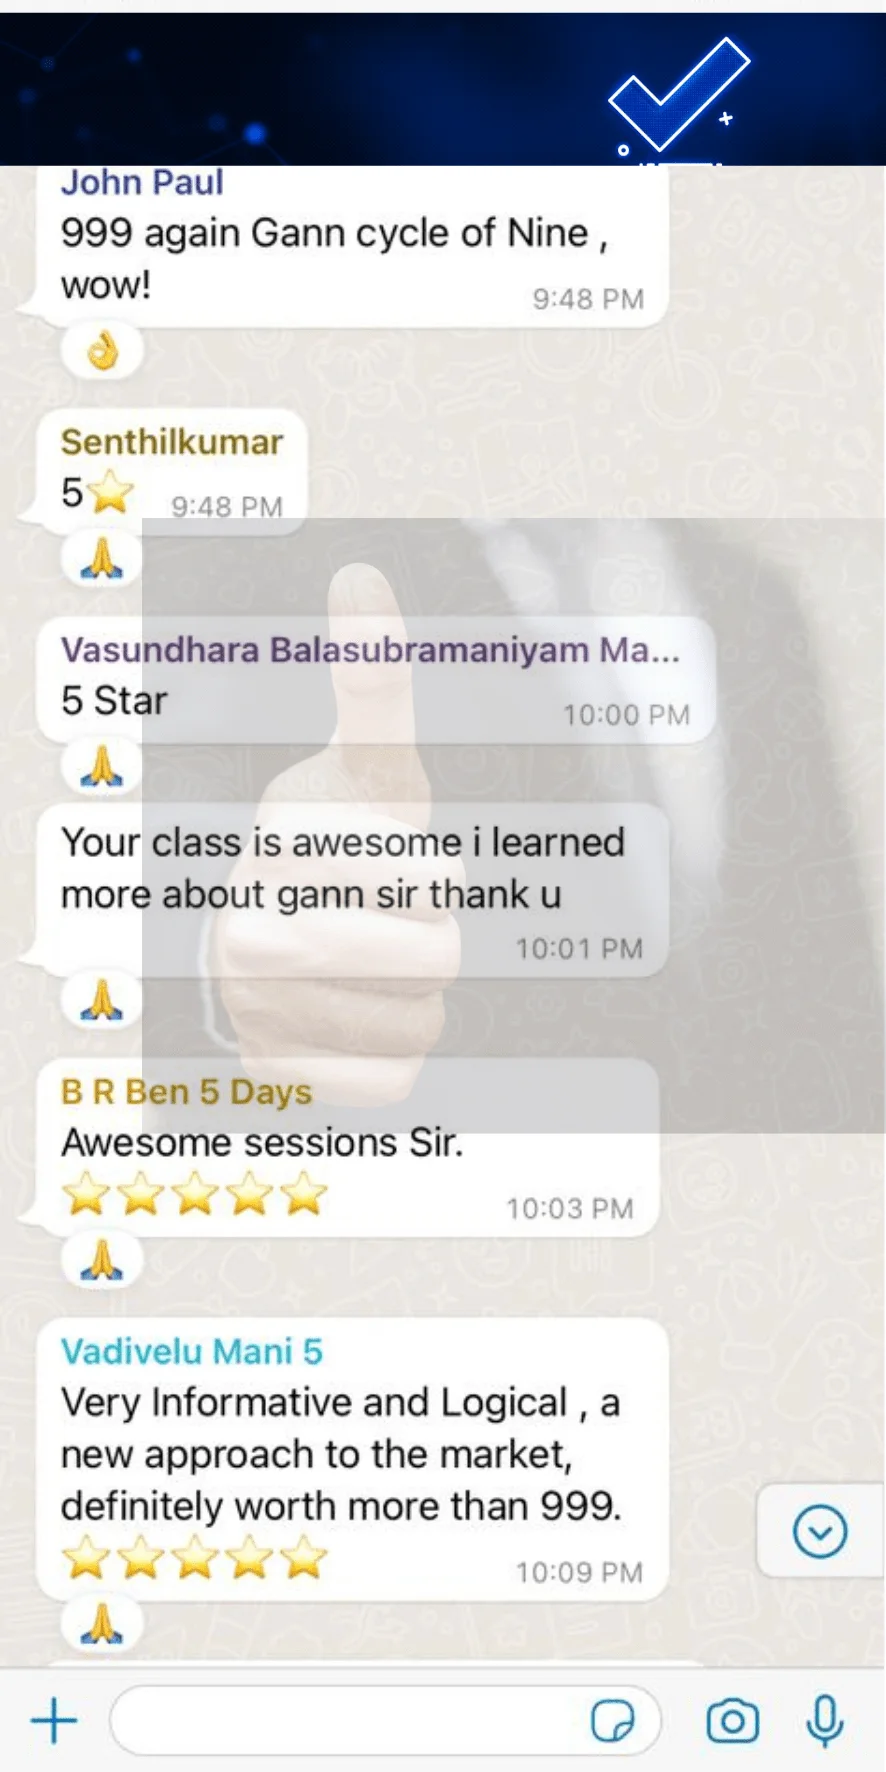
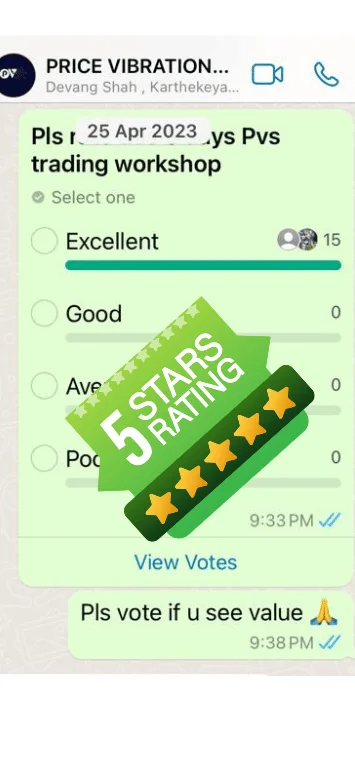
WHAT TRADERS ARE SAYING

Student video testimonial

Real experiences. Real learning.

LIVE. INTERACTIVE. PRACTICAL.

3Live Sessions
90Minutes Each
ON ZOOM
See the concepts explained.
See the methodology applied to real market charts.
Experience the approach live before deciding whether you want to go deeper.

READY TO SEE PRICE DIFFERENTLY?

3-DAY PRICE VIBRATION TRADING MASTERCLASS
INSTITUTIONAL BEHAVIOUR + PRICE + MATHEMATICS
BONUS: INTRODUCTION TO THE SQUARE OF 9
99
Live on Zoom · 3 Sessions · Beginner-Friendly

PRICE IS ALWAYS MOVING.
THE QUESTION IS WHETHER YOU UNDERSTAND WHAT IT IS TELLING YOU.

DECODE PRICE. MEASURE MOVEMENT. ANTICIPATE WHAT'S NEXT.

DISCOVER THE PRICE VIBRATION METHOD

99ALL 3 LIVE DAYS
Live on Zoom · Beginner-Friendly
Bonus: Introduction to the Square of 9